
Financial Capability and Financial Health
Evidence-based strategies about initiatives to promote financial security, including financial resilience, capability, inclusion, financial wellness, coaching, skills, knowledge, and behaviours.
An important consideration when thinking about an individual’s financial capability and financial health is
cultural and social practices around money.
How to Navigate this Page
Select policy targets and evidence-based strategies that are priorities and achievable within your setting and sector. Align with your mandate, capacity, jurisdictional boundaries, and scope of practice.
Strategies marked with ☔ are important for populations-at-risk.
Entry Point for Action:
Reflects the organization’s or government unit’s sector scope and mandate
Policy Target:
Relates to the initiative’s focus
Evidence-based Strategies:
Concrete actions to guide initiatives’ design, delivery, and evaluation
SAMPLE INDICATORS
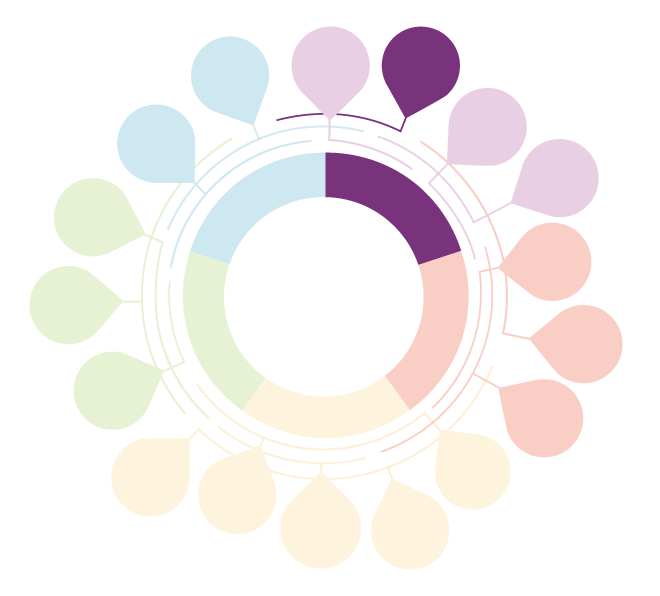
In countries with universal government-funded health systems:
- Eligible people’s (e.g., citizens) levels of satisfaction with the quality of health care services
- People’s perceived level of difficulty in accessing health care services (e.g., eligibility for services)
- Number/percentage of government units with regulatory and financial policy tools for essential services
- Number/percentage of people ineligible for the universal health care system (e.g., noncitizen residents) who report having access to high-quality health services at low cost
- Perceived ability to meet health-related costs among people ineligible for the universal health care system, stratified by socioeconomic status
- Trends of out-of-pocket expenditures on health among people ineligible for the universal health care system
- Number/percentage of people ineligible for the universal health care system reporting fear of the financial costs associated with health care use
- Inequalities between eligible and ineligible groups regarding health status, use of health care services, and health-related debts
In countries with (non)universal public and/or private insurance systems:
- Number/percentage of government units with effective regulatory controls ensuring actions from for-profit and not-for-profit organizations are aligned with the public interest and health goals, particularly regarding quality, costs, and access to health services
- Number of countries with regulation of private sector and good regulatory capacity ensuring strict management and financial protection in the health care sector
- Average of household expenditure on health care expenses, stratified by socioeconomic status
- Individual perceived financial hardship associated with use of private health care services
- Health inequalities between patients of the private health care sector and patients of the public health care sector
- Financial health inequalities between patients of the private health care sector and patients of the public health care sector
- Number/percentage of Emergency Department visits, stratified by socioeconomic status
- Number/percentage of preventable pediatric hospitalization per year, stratified by socioeconomic status
- Average cost of an admitted emergency visit
SAMPLE INDICATORS
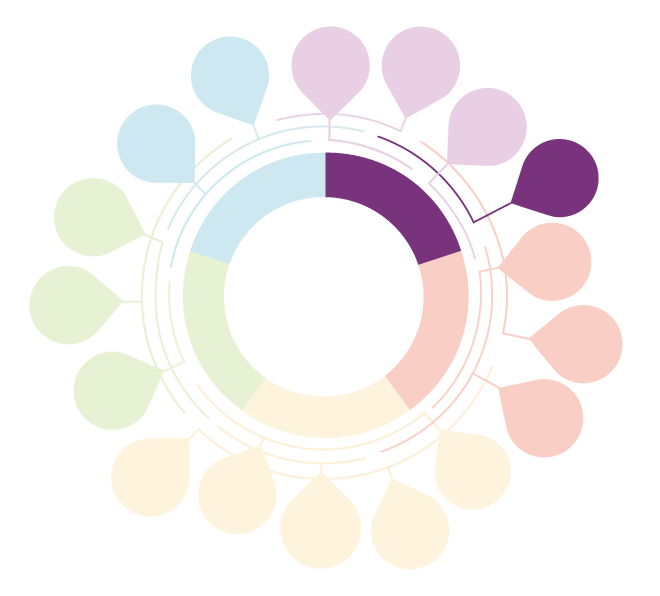
- Number/percentage of financial capability programs using key performance indicators to measure success (e.g., change in participants’ self-rated or measured financial capability) that go beyond funder priorities (e.g., participation rates) and consider multiple aspects of people’s lives
- Number/percentage of financial capability programs that address the social and structural determinants of people’s financial circumstances
SAMPLE INDICATORS
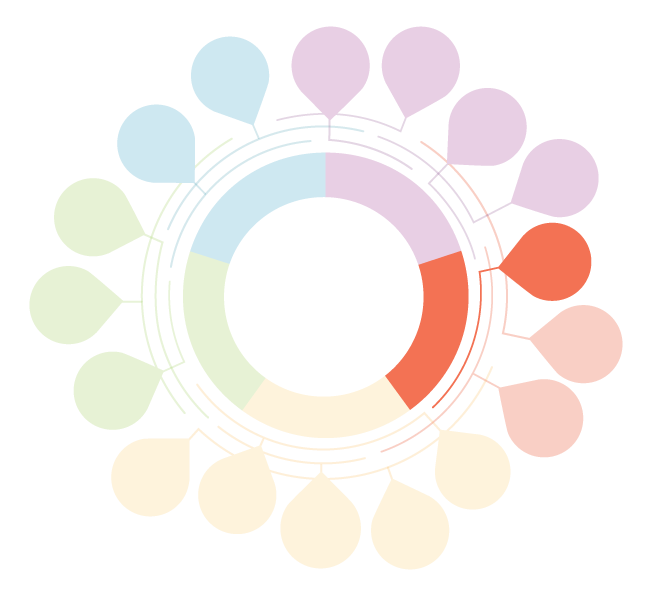
- Number/percentage of people feeling their financial situation is worsening
- Levels of financial stress (e.g., stratified by sex, gender, race/ethnicity, or household income)
- Poverty levels
SAMPLE INDICATORS
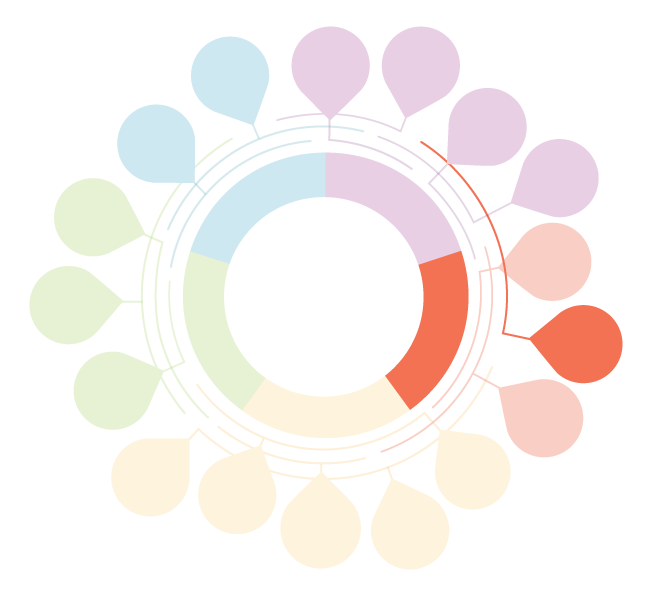
- Number/percentage of initiatives defining improvements in individual financial circumstances as a top priority
- Overall wellbeing rates at the population level
SAMPLE INDICATORS
- Number/percentage of recipients lifted out of poverty
- Median household income of beneficiaries
- Beneficiaries’ perceptions of benefits adjusted to a livable wage
- Overall wellbeing and financial wellbeing levels among beneficiaries (e.g., before and after recalibration of benefits)
- Poverty gaps between beneficiaries and non-beneficiaries (who are financially better off)
- Health gaps between beneficiaries and non-beneficiaries (who are financially better off)
- Household food insecurity
- Effects of increased monetary support on demand for programs
SAMPLE INDICATORS
- Number/percentage of unbanked or underbanked people
- Trends in banking account ownership
- Access to basic services (e.g., heating and water) increase among people who were previously unbanked or underbanked
- Chances to secure employment improve among those people who recently obtained access to mainstream banking services
- Number/percentage of people receiving electronic social welfare benefits payments
SAMPLE INDICATORS
- Number/percentage of participants who established a credit score for the first time at the end of program
- Number/percentage of people reporting an increase in their credit score
- Number/ percentage of low-income people who apply for and are successful in obtaining specialized loans
- Annual personal savings rate
- Average saving per person increases, particularly among low-income earners, while also being able to meet other financial obligations
- High number/proportion of people receiving high-quality financial advice online or in-person
SAMPLE INDICATORS
- Number/percentage of innovative and affordable or no-fee banking services and products
- Access to innovative and affordable or no-fee banking services and products
- Number/percentage of underbanked, low-income people who agree with the statement that banking services and products meet their unique needs and short- and long-term goals
- Number/percentage of low-income people with access to no-fee banking services and products
SAMPLE INDICATORS
- Availability of affordable or no-fee banking services and products (e.g., per jurisdiction)
- Number/percentage of clients who report that their banking services accommodate their individual values and needs (e.g., relative to socioeconomic status or life circumstances)
- Number/percentage of people who report that they can easily find and access banking services and products that meet their needs
SAMPLE INDICATORS
- Distance to the nearest banking outlets for target population(s)
- Number/locations of banking outlets in a given area relative to the distribution of the population’s need for services
SAMPLE INDICATORS
- Number/percentage of initiatives using infographics (or other visual means) in their information materials to support easy and clear communication of a topic
- Availability of materials through different media channels (e.g., magazines, websites, billboards, brochures, social media)
- Number/percentage of initiatives adopting inclusive communication through language and format (e.g., adequate font size for people with impaired vision and plain language use)
SAMPLE INDICATORS
- Knowledge of the advantages and disadvantages of the formal financial system
- Perceived access to affordable, no-fee financial services and products within the formal financial system (e.g., among disadvantaged people)
SAMPLE INDICATORS
- Number/percentage of people who asked for an extension for repayment
- Number/percentage of people who failed to repay loan instalments by the deadline
- Number/percentage of people who take loans to repay existing loans
- Perceived level of difficulty to manage debts
SAMPLE INDICATORS
- Financial confidence levels (e.g., among disadvantaged groups)
- Number/percentage of people who report ease in finding the financial services and products they need within formal, semiformal, and informal financial systems, that are supportive to their financial security (e.g., stratified by deprivation levels)
SAMPLE INDICATORS
- Availability and accessibility of accurate and relevant information about semi-formal and informal financial services, products, and practices
- Number/percentage of people reporting confidence in assessing the advantages and disadvantages of the non-mainstream banking system (e.g., among disadvantaged groups)
- Number/percentage of disadvantaged people reporting that reliable semi-formal or informal financial services and products better meet their needs
- Availability and perceived accessibility of mechanisms for people to report abusive and exploitation financial practices and obtain timely redress
SAMPLE INDICATORS
- Availability of in-person (face-to-face or virtual) financial literacy programs
- Availability of online financial literacy programs
- Access to financial literacy programs (e.g., to all people in the community)
- Availability of free or low-cost financial literacy programs
- Knowledge of financial systems, institutions, products, services, and money management
- Number/percentage of people who report knowing where to find the accurate, relevant, timely information needed to support their financial decision-making
- Number/percentage of people who report shopping around and being able to consider several options before making a financial decision
SAMPLE INDICATORS
- Availability of free or low-cost financial in person (or online) capability programs
- People’s perceptions of the level of difficulty required for accessing financial capability programs (e.g., stratified by socioeconomic status)
- Number/percentage of people with positive attitudes towards saving before and after participation in financial education programs
- Number/percentage of financial educators and practitioners who report participants developed negative attitudes toward risky borrowing
- Confidence in knowledge and skills regarding day-to-day money management
- Number/percentage of people whose basic needs are met reporting staying within their budget (e.g., stratified by age and socioeconomic status)
- Perceived ability to meet financial obligation and daily needs
- Number/percentage of people who report considering spending money carefully and making informed financial decisions (e.g., stratified by sex, gender and age)
SAMPLE INDICATORS
- People’s perception of financial practitioners hearing and respecting their financial concerns and needs
- Number/percentage of people who felt that financial practitioners developed customized strategies that met their needs and values
- Number/percentage of financial educators and practitioners who report delivering personalized financial guidance and information according to people’s life circumstances and trajectories
- Level of agreement with the statement that personalized steps outlined for improved financial literacy and capability are realistic and achievable
SAMPLE INDICATORS
- Number/percentage of people who report knowing where to find appropriate, relevant, and accurate financial information and advice for making financial decisions
- People’s perceptions of difficulty in finding financial services and products that meet their needs and values
SAMPLE INDICATORS
- Number/percentage of people feeling confident about their financial knowledge and skills in identifying and avoiding exploitative financial services and products
- Number/percentage of people who report understanding the warning signs of financial exploitation
SAMPLE INDICATORS
- Number/percentage of financial educators and practitioners who report delivering content/sessions dedicated to informal and semi-formal financial services and programs
- Number/percentage of financial literacy and financial capability program participants who now feel well-informed on financial facts and concepts (i.e., improved financial knowledge)
- Number/percentage of financial literacy and financial capability program participants who now feel well-instructed on how and where to find, understand, and act on financial resources (i.e., improved financial skills)
SAMPLE INDICATORS
- Availability of opportunities for promotion and career advancement (e.g., stratified by sex, gender, sexual orientation, and race/ethnicity)
- Accommodation of breastfeeding employees’ requirements in workplaces
- Number/percentage of terminations of employment for failure to perform due to age or disability (i.e., where no legal protections exist)
SAMPLE INDICATORS
- Number/percentage of existing programs and benefits that expand their target audiences, including population groups with need who were not previously targeted
- Availability of new supports and benefits for target groups with high, complex needs
- Access to income supports (e.g., among workers in precarious employment and working age people out of the labour force)
- Income security (e.g., among workers in precarious employment and working age people out of the labour force)
- Self-reported high/low variability of income
SAMPLE INDICATORS
- Number/percentage of low-income people who enroll in free or low-cost education and training courses
- Trends in the highest level of education achieved by adults
- Availability of varied reliable, affordable financial services and products (e.g., to low-income people)
- Availability of cash assistance
- Perceived ability to provide for oneself and one’s family
- Perceived ability to cover basic needs and enjoy economic stability (e.g., among low-income individuals and families)
- Number/percentage of people who report having money left over after meeting basic needs
SAMPLE INDICATORS
- Number/percentage of people reporting not feeling judged for their cultural values shaping their financial decisions
- Number/percentage of people who report finding supportive environments to share their stories and lived experiences when discussing financial issues
SAMPLE INDICATORS
- Perception about strategies being respectful to the people’s sociocultural values and meanings attributed to their economic resources
- Number/percentage of people who report not feeling bullied or intimidated by staff over financial matters
- Number/percentage of records of abusive interactions with staff during financial decision-making
SAMPLE INDICATORS
- Number/percentage of initiatives with flexible implementation to accommodate targeted populations’ values and needs
SAMPLE INDICATORS
- Number/percentage of people who report difficulties in refusing to lend money to family and friends
- Number/percentage of people feeling confident they can turn to relatives and friends for financial emergencies
- Periodic staff training programs and learning opportunities about recognition and respect of diverse sociocultural norms and expectations around financial practices
SAMPLE INDICATORS
- Number/percentage of caregivers feeling that society acknowledges their work by providing paid leave with no contingencies or conditions
- Levels of self-reported satisfaction with government unit assistance and paid caregiving services (e.g., stratified by socioeconomic status)
- Financial stress among caregivers (e.g., stratified by age, sex, and gender)
- Number/percentage of initiatives that acknowledge, respect, protect, and incorporate ancestral knowledge and traditions from Indigenous communities
- Number/percentage of Indigenous communities that feel the initiative symbolically values the cultural and environmental work they perform in the community (e.g., in remote communities)
- Distribution of benefits per type of caregivers
ENTRY POINT FOR ACTION
SAMPLE INDICATORS
- Individual levels of financial stress due to high debt load
- Number/percentage of people seeking appropriate, reliable support to debt repayment
- Number/percentage of people who report feeling that their debts are easily manageable
- Level of non-mortgage debt before and after program
SAMPLE INDICATORS
- Number/percentage of people who report enjoying power to choose whatever financial services and products best meet their needs (e.g., stratified by socioeconomic status)
- Web accessibility
- Use of assistive technology in online and mobile financial services
- Number/percentage of rural and remote communities with adequate broadband infrastructure
- Trends in use of financial apps and online services (e.g., among people with vision disabilities)
SAMPLE INDICATORS
- Household wealth by age (e.g., stratified by race/ethnicity, immigration status)
- Share of household wealth by generation
- Trends of wealth distribution at societal level
- Levels of participation in government-led saving plans/accounts to fund post-secondary education for children (e.g., stratified by household income, immigration status)
SAMPLE INDICATORS
- Perceived control over financial resources
- Percentage of conditional cash transfers to women (compared to men)
- Social benefits payment to the accounts of people experiencing disabilities
- Self-reported shared responsibility for managing household finances
- Self-reported financial role within household (i.e., dependent, contributor, key financial decision-maker)
- Person responsible for budgeting in the household
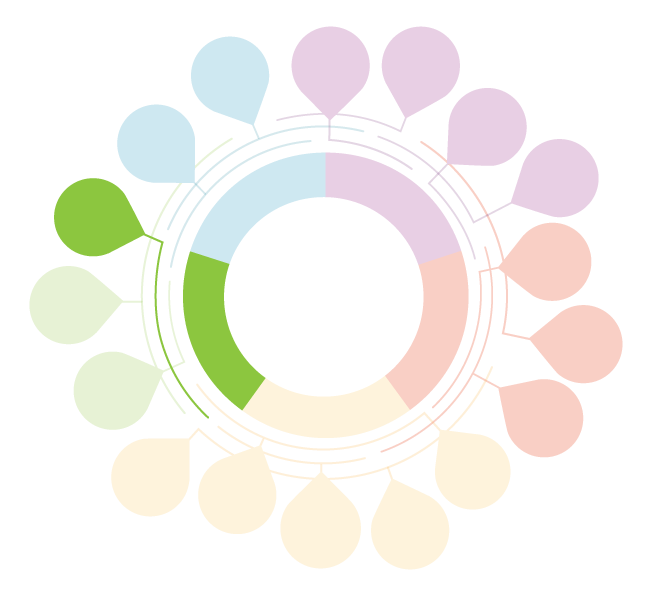
SAMPLE INDICATORS
- Number/percentage of people who report gaining or renewing their sense of control over their financial and life circumstances (e.g., stratified by sex, gender)
- Perception of ability to plan for financial future (e.g., stratified by age, immigration status)
ENTRY POINT FOR ACTION
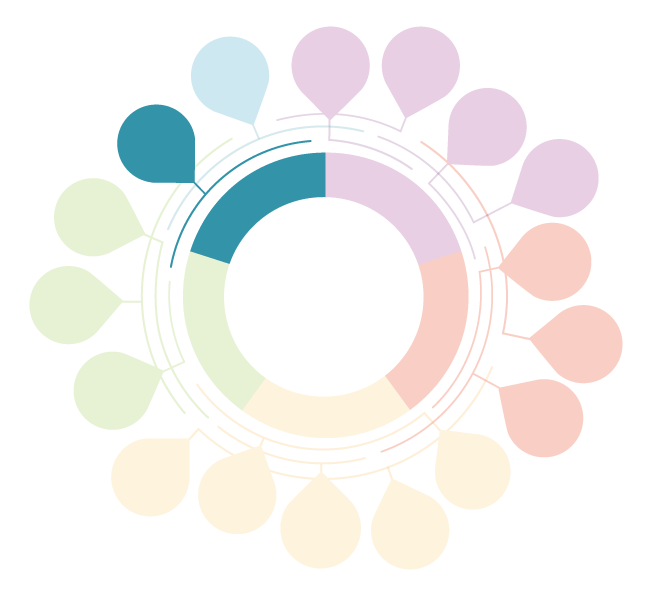
SAMPLE INDICATORS
- Ratio of recipients to people who meet program eligibility criteria
- Annual recipiency rates
- Number/percentage of people who report feeling encouraged to register in the programs and services
- Number/percentage of people with multiple, complex needs who have their benefits granted
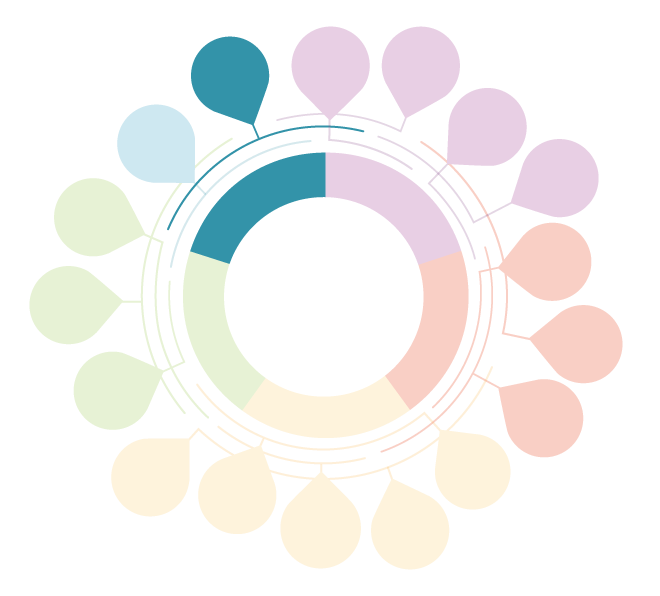
SAMPLE INDICATORS
- Number/percentage of people who report increasing their savings balance on a monthly or yearly basis, regardless of the amount
- Number/percentage of participants who report that they do not feel judged for their inability to save money
- Number/percentage of people who find it difficult to come up with a lump sum of money for an emergency
SAMPLE INDICATORS
- People’s perceived ability to save money
- Participation rate in automatic savings programs
- Self-reported amount (e.g., in Canadian dollars) that could be raised in a week
- Number/percentage of people who report savings for more than six consecutive months
SAMPLE INDICATORS
- Self-reported savings balance
- Individual debt management skills
- Self-reported capacity to meet living expenses (e.g., change in capacity over time)
- Confidence levels in ability to raise emergency funds (e.g., stratified by income levels)
- Average number of owned financial products (e.g., bank account, credit, insurance)
- Confidence levels in financial decision-making among participants of financial capability programs (i.e., knowledge acquisition, skill development, and concrete opportunities for behaviour change)
- Number/percentage of people who report leveraging financial support from social networks to meet their financial needs
- Number/percentage of people who feel their community connections help them navigate available services (i.e., proxy of social capital)
SAMPLE INDICATORS
- Number/percentage of people who report having access to clear and accurate information about the socioeconomic consequences of filing for bankruptcy, such as a reduced credit rating (included in their credit reports for years) and difficulties in obtaining loans, a mortgage, or credit cards
- People’s reports on their experiences in finding and using free, reliable, and unbiased financial advice (e.g., credit counsellor) to help them navigate their debts and improve their financial situations
- Bankruptcy rate
SAMPLE INDICATORS
- Confidence levels about plans to pay off debt
- Individual’s perceptions of progress towards paying down their debt
- Number/percentage of participants who report knowing how and where to go for information and advice before making financial decisions
SAMPLE INDICATORS
- Financial attitudes and behaviours (e.g., credit use, spending, and savings) before and after filing for bankruptcy
- Number/percentage of people who agree their bankruptcy meant a fresh start in life (e.g., stratified by socioeconomic status)
- Levels of self-reported satisfaction with current financial situation (e.g., stratified by income levels)
SAMPLE INDICATORS
- Confidence levels in financial skills
- Confidence levels in financial decision-making
- Perceived ability to pursue financial goals
SAMPLE INDICATORS
- Number/percentage of people who report keeping watch of their financial affairs
- Number/percentage of people who feel well-informed about finances
- Number/percentage of people who report weighing risks and benefits before choosing financial services and products
SAMPLE INDICATORS
- Number/percentage of low-income people who feel the services and programs set up achievable and realistic goals for them
- Number/percentage of people who report feeling confident about navigating through life transitions
- Levels of confidence in budgeting and managing finances
- Risks to debt (e.g., middle-income people facing financial windfalls)